Fourth Quarter 2022 Write-Up
After a very strong year for equities in 2021, we worried that the Federal Reserve was seriously behind the curve with regard to likely inflation rates, and that this could make for a rocky 2022. They were and it did. The Dow Jones Industrial Average was down 8.8% for calendar 2022, the Standard & Poor’s 500 Index declined 19.4% and the Nasdaq Composite plummeted 33.1%. Galloping inflation, higher interest rates, tighter monetary conditions, supply chain constraints and bottlenecks, very tight labor markets, elevated cost pass-throughs and higher food and energy costs all weighed on the markets during 2022. But the year was not without investment highlights: on January 3rd, the first trading day of 2022, the S&P 500 Index reached an all-time high. That event pretty much exhausts our investment highlights list. To put that event in context, 2021 saw 70 record highs versus the one record reached in 2022. To be fair, the market has offered a pretty impressive run of years with multiple record highs: every year going back to 2013. We are mindful, however, that since the year 2000, there have been eleven years that passed without seeing a record S&P 500 record. The S&P also saw an elevated number of daily declines of 1.0% or more, with 65 days, versus 21 in 2021. This was the most since 2008 (78 days), and the third highest in the last thirty years. Poor performance was not unique to the S&P 500, unfortunately. High yield bonds lost 12.7%, fixed income dropped 13.0%, developed market equities declined 14.0%, emerging market equities lost 19.7%, small cap equities fell 20.4% and REITs saw losses of 24.9%. The 10-year Treasury bond lost 17.8%, its largest decline since 1928, and only the second time it recorded a double-digit loss. Previous to this loss, since 1928 the 10-year has declined in value only eighteen times, usually in single-digit amounts. The poor performance of both bonds and equities (the first time since 1928 that both assets declined more than 10.0% in the same year) meant that the traditional 60/40 portfolio had its largest recorded annual loss (-18.0%) since 1937 (-20.7%). It was an epically awful year. To assess what to expect in 2023 and beyond, we need to examine both equity valuations and interest rates.
One way to view the 19.4% loss to the S&P 500 during 2022, is to break it down into its components: the P/E multiple and earnings. Between 2021 and 2022 year-end, forward earnings estimates grew 2.6% while the P/E multiple contracted 22.0%. Looking at the equity market’s fundamental valuation, JP Morgan reports that the S&P 500 at year-end was trading at a 16.7x forward P/E ratio and a current dividend yield of 1.8%. While that is not exactly cheap, it is in line with historical averages over the last twenty-five years, and is certainly better than the January 3rd, 2022 readings of 21.4x and 1.3%. At market lows in 2020, 2009 and 2002, the S&P traded at forward P/Es of 13.3x, 10.4x and 14.1x, respectively. At market peaks in 2022, 2020, 2007 and 2000, the S&P traded at 21.4x, 19.2x, 15.1x and 25.2x, respectively. As always there is a caveat: when a recession hits, forward earnings estimates usually decline. With the Federal Reserve aggressively boosting interest rates, a recession is widely anticipated in 2023. Equity valuations reflect other investment alternatives, such as fixed income instruments. At the beginning of 2022, the yield on the 10-year Treasury was 1.6%, while today it sits at about 3.5% (and was 3.9% on December 31st, 2022). Near-term interest rates are trading below the current rate of inflation, and the trend of the 10-year Treasury suggests that the market expects a decline in core inflation rates and a more accommodative Federal Reserve. The current valuation of equities suggests a soft-landing, or, at most, a very mild recession. If inflation heats up, and the Fed is less than accommodative, then current equity valuations will not provide much of a buffer. Both equity and fixed income markets are showing confidence in the Federal Reserve.
The University of Michigan Survey of Consumers showed declines in short-run inflation expectations and a 2.9% expectation of long-run inflation. The New York Fed’s survey showed declining one-year ahead inflation expectations at 5.0%, a 3.0% level for medium-term (3-year) expectations and a 2.4% expectation for five years from now. The quarterly Survey of Professional Forecasters estimates 2.9% inflation, on average, for the next five years. Finally, the Treasury market is expecting a 2.3% inflation rate (inferred by subtracting the inflation-indexed TIPS yield from the 5-year constant coupon nominal Treasury note’s yield). This implied 5-year inflation rate was as high as 3.6% in March of last year. The Fed is widely expected to enter the final inning of its rate hiking cycle in the first quarter of 2023. At the time of writing, markets anticipate the fed funds rate will reach a peak (terminal) rate of 5.0% (or a target range of 4.75%-5.00%) by May 2023. At its December meeting, the Fed projected Personal Consumption Expenditure (PCE) inflation rates of 3.1% for 2023, 2.5% for 2024 and 2.1% for 2025. These projections were slightly higher than those it made in September. Sadly, we must recall that the Federal Reserve in December 2021 projected a Federal funds rate of 0.9% in 2022, which turned out to be quite a bit off from the actual realized rate of 4.4%. Kudos, however, to the Fed for starting to hike aggressively once it realized that inflation was not transitory.
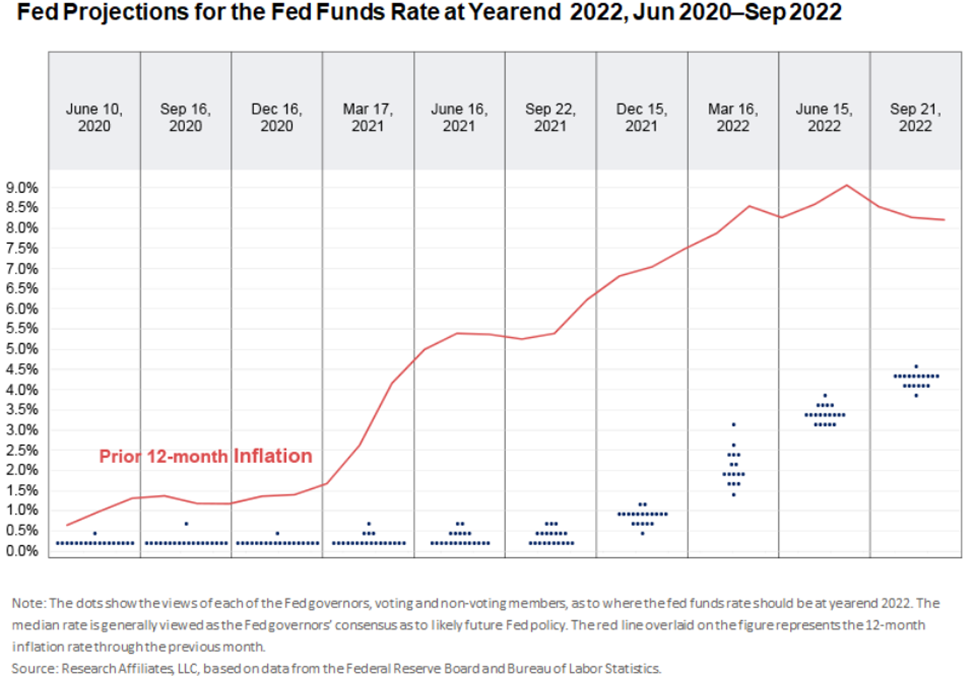
The markets anticipate an accelerated timeframe for the Fed to beat down inflation. While this is possible, it has happened rarely in the past. David Stockman, Reagan’s former budget director, reminds us that it took the great Paul Volker two years for his extreme policy intervention to cut inflation to half its peak level (to 7.0%), and over six years to bring inflation down to 2.0%. Rob Arnott and Omid Shakernia of Research Affiliates studied all 52 cases where inflation surged above 4.0% in 14 OECD developed-economy countries from January 1970 through September 2022. What they found can be summarized: If inflation is cresting, 4.0% and 6.0% inflation reverts by half (to 2.0% and 3.0%) in about a year. If inflation is accelerating, 6.0% inflation reverts to 3.0% in a median of about seven years. The CPI exceeded 9.0% in June, and finished 2022 at 6.5%. Arnott also notes a meta-analysis that found that across 198 instances of policy rate hikes of 1.0% or more in developed economies, the average lag until a 1.0% decrease in inflation was achieved was between roughly two and four years. The Federal Reserve might be able to achieve the timeline that markets currently anticipate, but it will be a heavy lift. One advantage that our Fed has over the other central banks that Arnott studied, is its enormous $7.0 trillion balance sheet of Treasuries and mortgage-backed securities. If the Fed can increase quantitative tightening by accelerating divestment, it might be able to rely less on abrupt increases in policy rates. The chart below reflects how late the Fed was to act.
While the market’s current timeline might be the triumph of hope over experience, we do not doubt that the Federal Reserve is very serious about addressing inflation. That is very good news for long-term investors. Bonds are now investable again, and there are pockets of attractive value among stocks. This year might not be smooth sailing, but we think it will build a solid foundation for attractive returns. Stay the course, and damn the torpedoes.
Sincerely,
Your Team at Baxter Investment Management