Second Quarter 2023 Write-Up
Equity markets were strong in the first half of 2023. For the first six months of the year, the Dow Jones Industrial Index gained 3.8%, the Standard & Poor’s 500 Index added 15.9% and the Nasdaq surged 31.7%, mostly on the back of outsized performance from a handful of mega-cap tech stocks that performed abysmally last year. Seven big tech stocks (Facebook, Apple, Amazon, Google, Microsoft, Tesla, and Nvidia) comprise 27.0% of the S&P 500 Index’s market capitalization and provided a 61.1% gain while the other 493 S&P stocks comprised 73.0% of the Index’s capitalization, and contributed a 5.9% gain. In other words, the Big Seven stocks contributed 74.0% of the 16.9% gain in the first half of 2023 (See Exhibit 1). During the market decline last year, these stocks were heavily penalized by the market, losing over 55.0% from their peak levels, on average. What a difference from six months ago. Interestingly, the mega-cap tech stocks sell at premium valuations, so while the S&P 500 index trades at 19x forward earnings (which is on the expensive side of historical multiples), the S&P 493 only trades at 16x forward earnings versus 31x forward earnings for the Big Seven. It is certainly an unusual market.
The ebullience of the Nasdaq and the solid returns of the S&P 500 Index have caused many market observers to rethink their economic outlook. Maybe the market is telling them something, they wonder. Last fall, the economic consensus strongly suggested a recession was due by the third or fourth quarter of this year. In fact, it was the most widely anticipated recession forecast that we can remember. Now the economic consensus seems to be forecasting a soft-landing, a softer economy that avoids a near-term recession. The best arguments for economic resilience are: 1) recent GDP growth exceeding economists’ expectations and 2) a tight labor market. Second quarter GDP growth came in at 2.4%, comfortably exceeding expectations of an 1.8% print. The first quarter’s GDP growth of 2.0% also surprised most economists. The first quarter’s GDP result displayed some anomalous data points, however, such as a 12.9% increase in current dollar disposable personal income. Many expected that the first quarter numbers would be revised. The second quarter GDP release looked cleaner. Compared to the first quarter, the acceleration in GDP in the second quarter primarily reflected an upturn in private inventory investment and an acceleration in nonresidential fixed investment. These movements were partly offset by a downturn in exports, and decelerations in consumer spending, federal government spending, and state and local government spending. Imports were lower.
On the employment front, total nonfarm payroll employment rose by 187,000 in July, and the unemployment rate was flat at 3.5%. The number of unemployed persons (5.8 million) changed little in July. The unemployment rate has ranged from 3.4% to 3.7% since March 2022. The BLS reported that labor productivity increased 3.7% in the second quarter of 2023, as output increased 2.4%, while hours worked declined by 1.3%. During the current business cycle, starting in the fourth quarter of 2019, labor productivity has grown at an annualized rate of 1.4%, as output grew at a 2.0% per year rate, outpacing hours worked, which grew at a 0.7% annual rate. The 1.4% annual rate of productivity growth in the current business cycle thus far is below the long-term historical average rate since 1947 of 2.1%. If labor productivity has returned, that is very good news for the economy. We are a bit skeptical at this point.
The number of persons not in the labor force who currently want a job was 5.2 million in July, little changed from the prior month. These individuals were not counted as unemployed because they were not actively looking for work during the 4 weeks preceding the survey or were unavailable to take a job. The number of people with a disability has increased significantly since 2020. The disabled population hovered around 30 million from 2015 through the pandemic. In the post pandemic period, the disabled population has increased from 29 million to 34 million, and the number of disabled people that are not included in the labor force has grown from 23 million to 25 million. It remains to be seen if the labor force grows as a result of low unemployment. The main takeaway is that the labor force is tight and unemployment is low. People with jobs spend money, and the soft-landing prognosticators believe that could keep us out of a recession.
To make the counter-argument, we look at the inverted yield curve. An inverted yield curve, where short-term interest rates are trading higher than longer-term interest rates (usually defined as the difference between one-year Treasury bills and ten-year Treasury notes) has been a very successful indicator of an impending recession (Exhibit 2). An inverted yield curve has accurately predicted all of the last nine recessions since 1960, and has only given one false positive warning in 1967-68. As an economic indicator, it doesn’t get much better than that. The lag period between the first inversion and the beginning of the predicted recession is variable, averaging about 14 months, but having been as short as six months (2020) and as long as 24 months (1969-70). Currently, we are about twelve months from when the yield curve first inverted. It is also true that in about half the recessions since 1960, the inversion ended before the recession began. The inverted yield curve is an excellent warning signal, but a pretty poor timing signal. A possible explanation for the economic resiliency during the last few months could trace directly to the actions of the Federal Reserve. Interest rates were very low when inflation started to gallop. The Fed chose to sit on its hands for almost a year, thinking that inflation was “transitory” and due mostly to exogenous and self-correcting bottlenecks and supply shortages stemming from the pandemic. As inflation accelerated, the Fed began a very measured (and predictable) tightening schedule. Because of the low level of initial rates, and the lag in response time, the Fed has only recently achieved real rates of interest that are positive (Exhibit 3). In other words, the Fed was remarkably accommodative despite a long run of interest rate increases. Negative real interest rates encourage economic expansion (and mal-investment).
Corporate earnings have not been supportive of the stock market’s recent rally. The S&P 500 reported quarterly earnings declines in the fourth quarter of 2022 and the first quarter of 2023. With about 80% of S&P 500 members having reported already, FactSet estimates that the Index is about to record its third consecutive quarterly decline, with earnings declining 5.2% from last year’s second quarter (See Exhibit 4). Another measure of corporate profits is published by the U.S. Bureau of Economic Analysis. Their National Income & Products report shows both pre-tax and after-tax corporate profits peaked in the second quarter of 2022 and have declined every quarter thereafter, through the first quarter of 2023. Likewise, U.S. government tax receipts are falling, which usually occurs in connection with a recession (Exhibit 5). Other indicators also suggest a slowing economy, such as the Conference Board’s Leading Economic Indicator Index (Exhibit 6), the shrinking of the money supply, as defined by M2, the University of Michigan’s Consumer Expectations Survey (Exhibit 7), and the Federal Reserve Board’s Senior Loan Officer Opinion Survey (Exhibit 8). Finally, there could be a liquidity drain created by the Fed’s continuation of Quantitative Tightening at the same time that the Treasury is trying to raise $1.0 trillion for its General Account. Has the economy been surprisingly resilient? Yes. Will it continue to show strength? That is a much tougher call.
We do not try to predict recessions, but we try to invest defensively given current conditions. What we can say about today’s investment environment is that equity risk premiums have collapsed, and this makes bonds a much more attractive investment option today than they have been in years. Adding some fixed income instruments to portfolios now is a prudent investment, that might do especially well if a recession is impending. Also, small and mid-cap stocks look much more attractive than large caps based on valuation levels (Exhibit 9). Although the major equity indices saw drastically divergent returns in the first half of 2023, the longer-term returns look more normal. Over the last three years through the end of June, the Dow Jones Industrial Average, the Standard and Poor’s 500 Index and the Nasdaq returned 10.1%, 12.8% and 11.1%, respectively. That leads us to believe it is better to try to build wealth using time as an ally, rather than to try to build wealth by using timing.
Sincerely,
Your Team at Baxter Investment Management
Baxter Investment Management turns 100 years old next year. There are now two employees representing the fourth generation of the Baxter family– Bill the 4th and Claire. Claire Baxter joined us in July. Claire graduated from Claremont Mckenna College in California in 2018 with a B.A. in Psychology and Economics. Claire played water polo for all four years and was the team captain for two of those years. After Claremont, she worked at Interactive Brokers. We are very excited to have her join our team.
Exhibit 1: Contribution to S&P 500 Performance 1H 2023: 
Exhibit 2: 
Exhibit 3: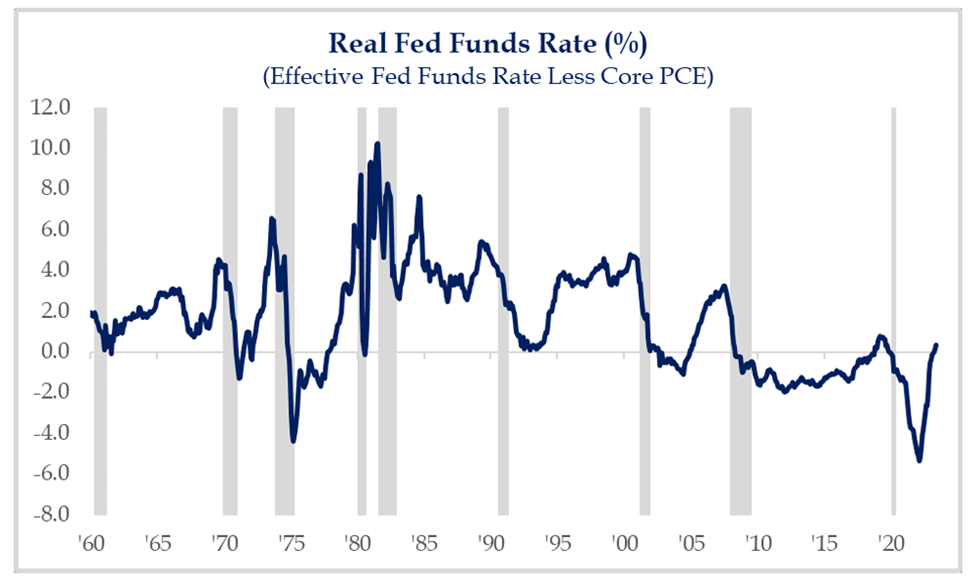
Exhibit 4:

Exhibit 5: Federal Government Current Tax Receipts:
Exhibit 6: 
Exhibit 7:
Exhibit 8:


Exhibit 9:
